

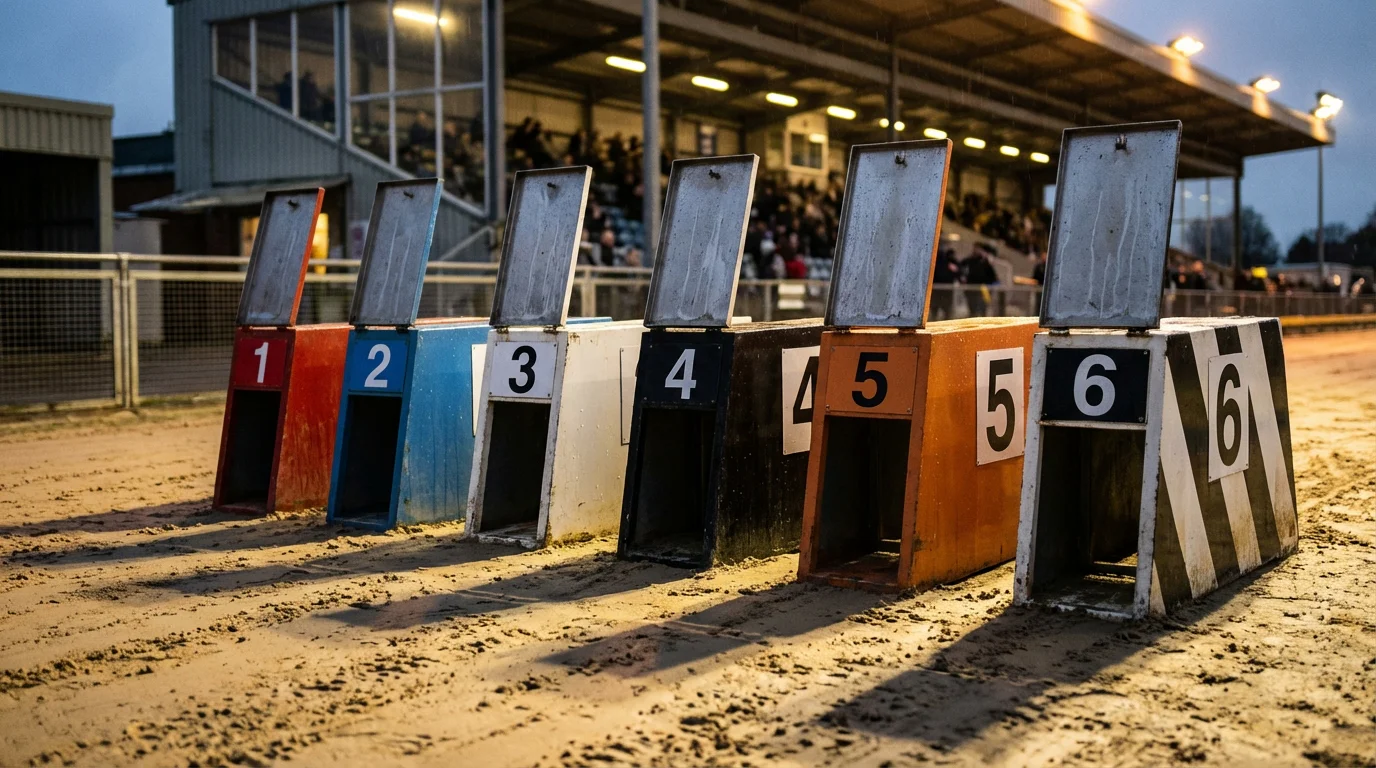
Trap Bias Is the Simplest Edge in Greyhound Betting
Of all the angles available to greyhound punters, trap bias is the one that requires the least interpretation and produces the most consistent results. The concept is basic: at any given track, certain trap numbers win more often than others. This is not opinion, superstition, or selective memory. It is a statistical fact that can be measured across thousands of races, and it exists because track geometry, bend tightness, and running rail position create structural advantages for specific starting positions.
Every UK greyhound stadium has its own trap bias profile. At some tracks, trap one dominates because the first bend is tight and the inside draw offers the shortest path to the rail. At others, the bias is less pronounced or shifts depending on the distance. A 480-metre race at a particular stadium might favour trap one, while the 270-metre sprint at the same venue favours trap six because the first bend is further from the boxes and the wide draw gives enough room for early pace dogs to clear the field.
The beauty of trap bias as a betting tool is its transparency. The data is publicly available, derived from historical results, and requires no subjective judgement to interpret. A trap that has won 22% of races over the past year against an expected average of 16.7% (one sixth of all outcomes in a six-dog race) is showing a statistically meaningful advantage. Whether you choose to use that information is up to you, but the information itself is not hiding.
UK Track Trap Win Percentages: The Data
In a perfectly fair six-dog race with no positional advantage, each trap would win exactly 16.7% of the time — one in six. In reality, no UK track produces a flat distribution across all six traps. The deviations are measurable, persistent, and track-specific.
Across the majority of UK GBGB stadiums running standard four-bend races over middle distances, trap one tends to produce the highest win percentage. This is not a marginal effect. At tracks with tight first bends, trap one win rates regularly sit between 19% and 24%, which represents a significant departure from the expected baseline. The advantage comes from geometry: the dog in trap one has the shortest run to the inside rail on the first bend, and if it breaks cleanly, it can establish rail position before any other runner. At speed, even a small positional advantage on a bend translates into lengths gained.
Trap two typically shows the second-highest win rate at most tracks, benefiting from a similar inside-rail dynamic but with slightly more ground to cover to secure position. Traps three and four tend to cluster near or slightly below the expected average, producing win rates in the 14% to 17% range at most venues. These middle traps suffer from traffic — dogs drawn here are frequently caught between faster starters from inside and outside, leading to bumping and checking on the first bend that costs them ground and momentum.
Traps five and six show more variation between tracks than any other positions. At tight-bended stadiums, these wide draws are a clear disadvantage, with win rates dropping to 12% or below. At tracks with wider, more sweeping bends, the disadvantage is reduced or even eliminated for dogs with enough early pace to overcome the geometry. Some sprint-course configurations actually favour the outside traps, because the distance to the first bend is long enough for a fast-breaking wide runner to cross the field and lead.
Distance matters within the same track. A stadium’s trap bias at 480 metres may not match its bias at 270 metres or 660 metres, because different distances use different sections of the track and different bend configurations. A punter who relies on overall trap bias data without filtering by distance is working with a blurred picture. The sharper view comes from distance-specific trap win percentages, which most form databases and statistics sites allow you to filter.
Seasonal shifts add another layer. Track conditions change through the year — sand surfaces run differently in cold, wet winter months compared to dry summer conditions. These changes can subtly alter how bends ride, which in turn affects trap bias. A trap that shows a strong advantage over a full year’s data might show a weaker advantage during specific months. The most thorough trap bias analysis uses rolling data — typically the last three to six months of results at a specific track and distance — rather than all-time figures that smooth out seasonal variation.
The data itself is accessible through several sources. Timeform, the GBGB’s own results archive, and specialist greyhound statistics sites all publish trap win percentages broken down by track and distance. Some require a subscription; others are free. The investment of time in pulling this data and maintaining a personal reference is one of the highest-returning habits a greyhound punter can develop, because the data changes slowly enough that a monthly update is sufficient to stay current.
How to Analyse Trap Bias for Betting Advantage
Having the data is the first step. Using it correctly is where the edge materialises. Trap bias analysis does not mean blindly backing the statistically favoured trap in every race. It means incorporating trap position as a weighted factor in your overall assessment, alongside form, grading, running style, and going conditions.
The starting point is to compare each dog’s trap draw against its preferred running style. A confirmed railer drawn in the statistically strongest inside trap is a double positive — the dog’s natural style aligns with the track’s structural advantage. That alignment should increase your confidence in the selection. A railer drawn in a trap that the data shows to be weak — say, trap five at a track where trap five wins only 11% of the time — is a mismatch that the market may or may not have priced correctly.
The most profitable application of trap bias is in identifying value, not in picking winners. If a dog drawn in trap one at a track with a 22% trap one win rate is priced at 4/1, the market is implying roughly a 20% chance of winning — which is close to the trap’s base advantage before you even consider the dog’s individual form. If the dog also has strong recent form and a running style that suits the inside draw, the real probability is higher than the market implies, and the bet offers value. Conversely, a dog drawn in a statistically weak trap whose price does not reflect that disadvantage is a candidate to oppose rather than support.
Sample size matters. A trap bias figure based on fifty races at a specific track and distance is suggestive but not conclusive. Random variation alone can produce apparent biases over small samples that disappear when more data accumulates. As a rough guide, you want at least two hundred to three hundred races at a given track and distance before treating the trap percentages as reliable. Below that threshold, the data is interesting but not actionable in isolation.
Cross-referencing trap bias with going conditions adds further precision. If you know that trap one’s advantage at a particular stadium is strongest on dry sand (because the rail runs fastest when the surface is firm) and the forecast says rain, the bias may be dampened for that evening’s card. Punters who track trap bias by condition as well as by track and distance are operating at a level of detail that most competitors never reach — and that detail is where consistent edges live.
When Trap Bias Doesn’t Help
Trap bias is a population-level statistic. It tells you what happens on average across hundreds of races. It does not tell you what will happen in any single race, and there are specific situations where applying trap bias data is either unhelpful or actively misleading.
Open races and high-grade events are the primary exception. In these fields, the quality of the dogs is high enough that individual ability overrides positional advantage. A genuinely superior dog can win from any trap because it is simply faster and more tactically capable than its opponents. Trap bias has its strongest effect in lower-grade races where the quality gap between dogs is small and positional advantage becomes the tiebreaker. In an A1 open race where the favourite is two lengths faster than anything else in the field, the trap draw is secondary.
Races with a dominant early-pace dog also neutralise trap bias. If one dog in the field has sectional times that show it reaches the first bend ahead of the pack regardless of draw, the trap bias data for the rest of the field becomes less relevant — the race shape is being dictated by that single dog’s speed, not by the track geometry. In those situations, your analysis should focus on whether the early-pace dog can maintain its advantage, not on whether its trap number is statistically favoured.
Finally, trap bias does not account for trouble in running, which is partly random and partly a function of the specific dogs drawn next to each other in a given race. Two dogs with a history of crowding in the middle traps create a localised problem that no aggregate statistic can predict. The data tells you what usually happens. The racecard tells you what might happen tonight.
Data Beats Instinct — But Only If You Use It
Most greyhound punters know that trap one is generally favourable and trap six is generally not. That surface-level awareness is where most people stop. The punter who goes further — who knows the exact win percentages at specific tracks and distances, who adjusts for seasonal conditions, who cross-references the data with each dog’s running style — is operating with information that the casual majority does not have. That information asymmetry is the definition of an edge.
Trap bias will not make you profitable on its own. No single factor in greyhound betting carries that weight. But as one layer in a structured approach — combined with form reading, grade assessment, and going analysis — it is among the most reliable and least subjective tools available. The data is there for anyone willing to collect and maintain it. The edge belongs to those who actually do.
Find more race analysis at greyhoundresultsyester.
Also read our greyhound trap colours and numbers.
